How to Read Forex Charts Like a Pro (Even If You’re New)
May 8

Understanding and analyzing price charts is essential. No matter which market you want to trade, understanding and reading price charts not only helps investors have a clearer view of the market but also improves decision-making ability, thereby optimizing profits and minimizing risks. Below, CPT Markets will guide you on how to read forex charts, which is especially useful for new investors.
What is Technical Analysis?
There are two schools of analysis: fundamental analysis and technical analysis. Fundamental analysis is based on news and aggregated data to predict market trends. Reading and understanding price charts is technical analysis.
Technical analysis is the prediction of future price movements based on the review of price movements in past periods. Like weather forecasting, technical analysis does not guarantee absolute accuracy in future predictions. Instead, this analytical tool helps investors predict the likely outcomes of prices over time.
Technical analysis can be applied to forex, stocks, commodities or any market where prices are influenced by supply and demand. Specifically, price data will refer to the opening price, the highest price, the lowest price, the closing price. Time frames can be based on different data, such as: 1 minute, 30 minutes, 1 hour... or price data by day, week or month. Without making you wait any longer, let's start right away to learn about the types of charts and popular support tools to better understand forex charts.
Forex Chart Reading Guide: 3 Chart Types You Need to Know
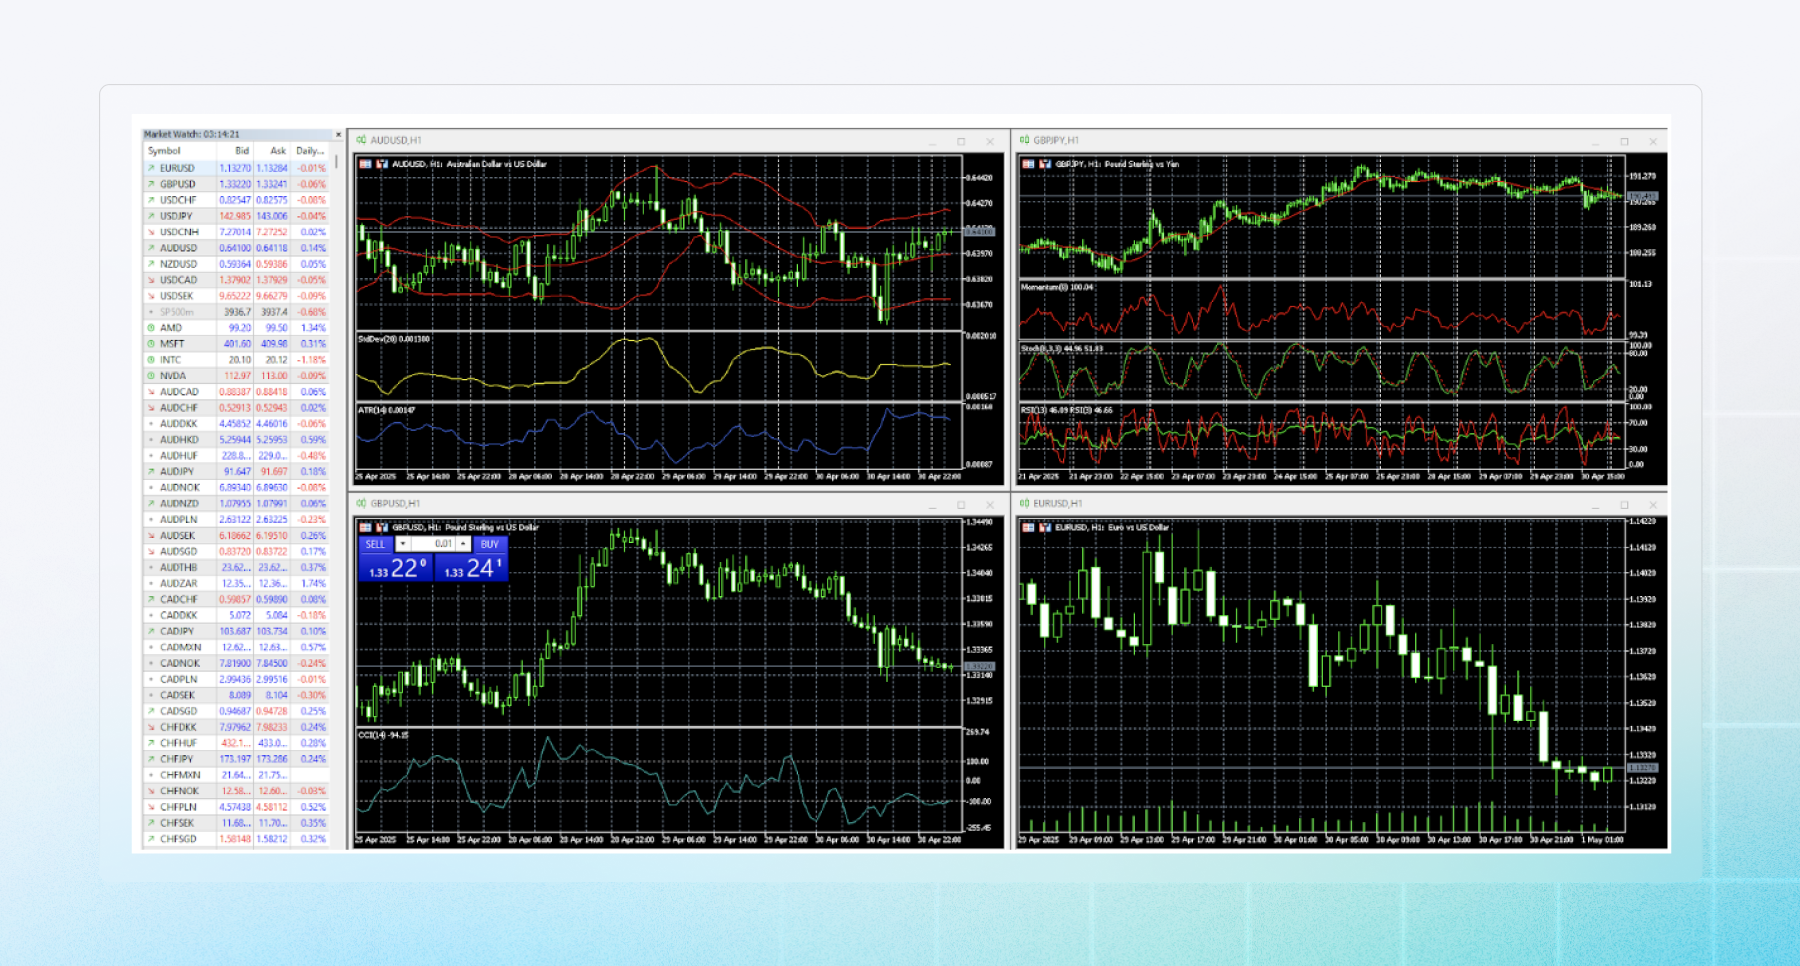
When you open a trading platform like MT4, MT5, or cTrader, you will see the option to change the chart type displayed. Let's start by understanding the three main chart types:
Line chart:
A line chart is the simplest type of chart used in trading. It draws a line connecting the closing prices of trading sessions over a specific period of time. This chart helps identify general trends and long-term price movements, but does not provide details about intraday price movements.
Bar chart:
Bar charts (also known as column charts) provide more detailed information than line charts. Each bar represents a specific period of time (such as a day or an hour) and shows the opening, closing, highest, and lowest prices for that period.
The top of the bar is the highest price, the bottom is the lowest price. The horizontal line to the left of the bar shows the opening price, while the line to the right shows the closing price. Bar charts help traders analyze price changes and trends over time.
Candlestick chart:
Japanese candlestick charts are a popular type of chart in trading because they provide similar information to bar charts but are easier to understand. Each candle represents a specific period of time and shows the open, close, high, and low prices. The candle body is colored (usually green for bullish periods and red for bearish periods). The wicks above and below the candle represent the highest and lowest prices during that period.
CPT Tip, if you are new, learn about candlestick charts because candlestick charts are very useful for identifying potential price movement patterns and trends in the forex market.
A bit of historical information about candlestick charting is that it originated in Japan in the 18th century, developed by Munehisa Homma, a rice trader to track rice prices. The chart provides a visual representation of price trends and market sentiment, helping traders make informed decisions. Later, Japanese candlestick charts were introduced to the West and became a popular tool in financial analysis.
Indicators on Forex Charts
In addition to chart customizations, on the trading platform you will find indicators such as RSI, MACD, Bollinger Bands. These are indicators that provide additional information about the strength and momentum of price trends. Through these indicators, you will save more time on analysis. Or you can also use them as a reference tool to confirm conditions before executing a trading order. There are two main types of indicators in technical analysis: trend indicators and momentum indicators, in which:
- Trend indicators help us determine the overall price trend (indicators such as MA, Bollinger Bands, ADX, Ichimoku Kinko Hyo...)
- Momentum indicators help assess the level of price volatility to find appropriate entry points (indicators MACD, RSI, Stochastic Oscillator...)
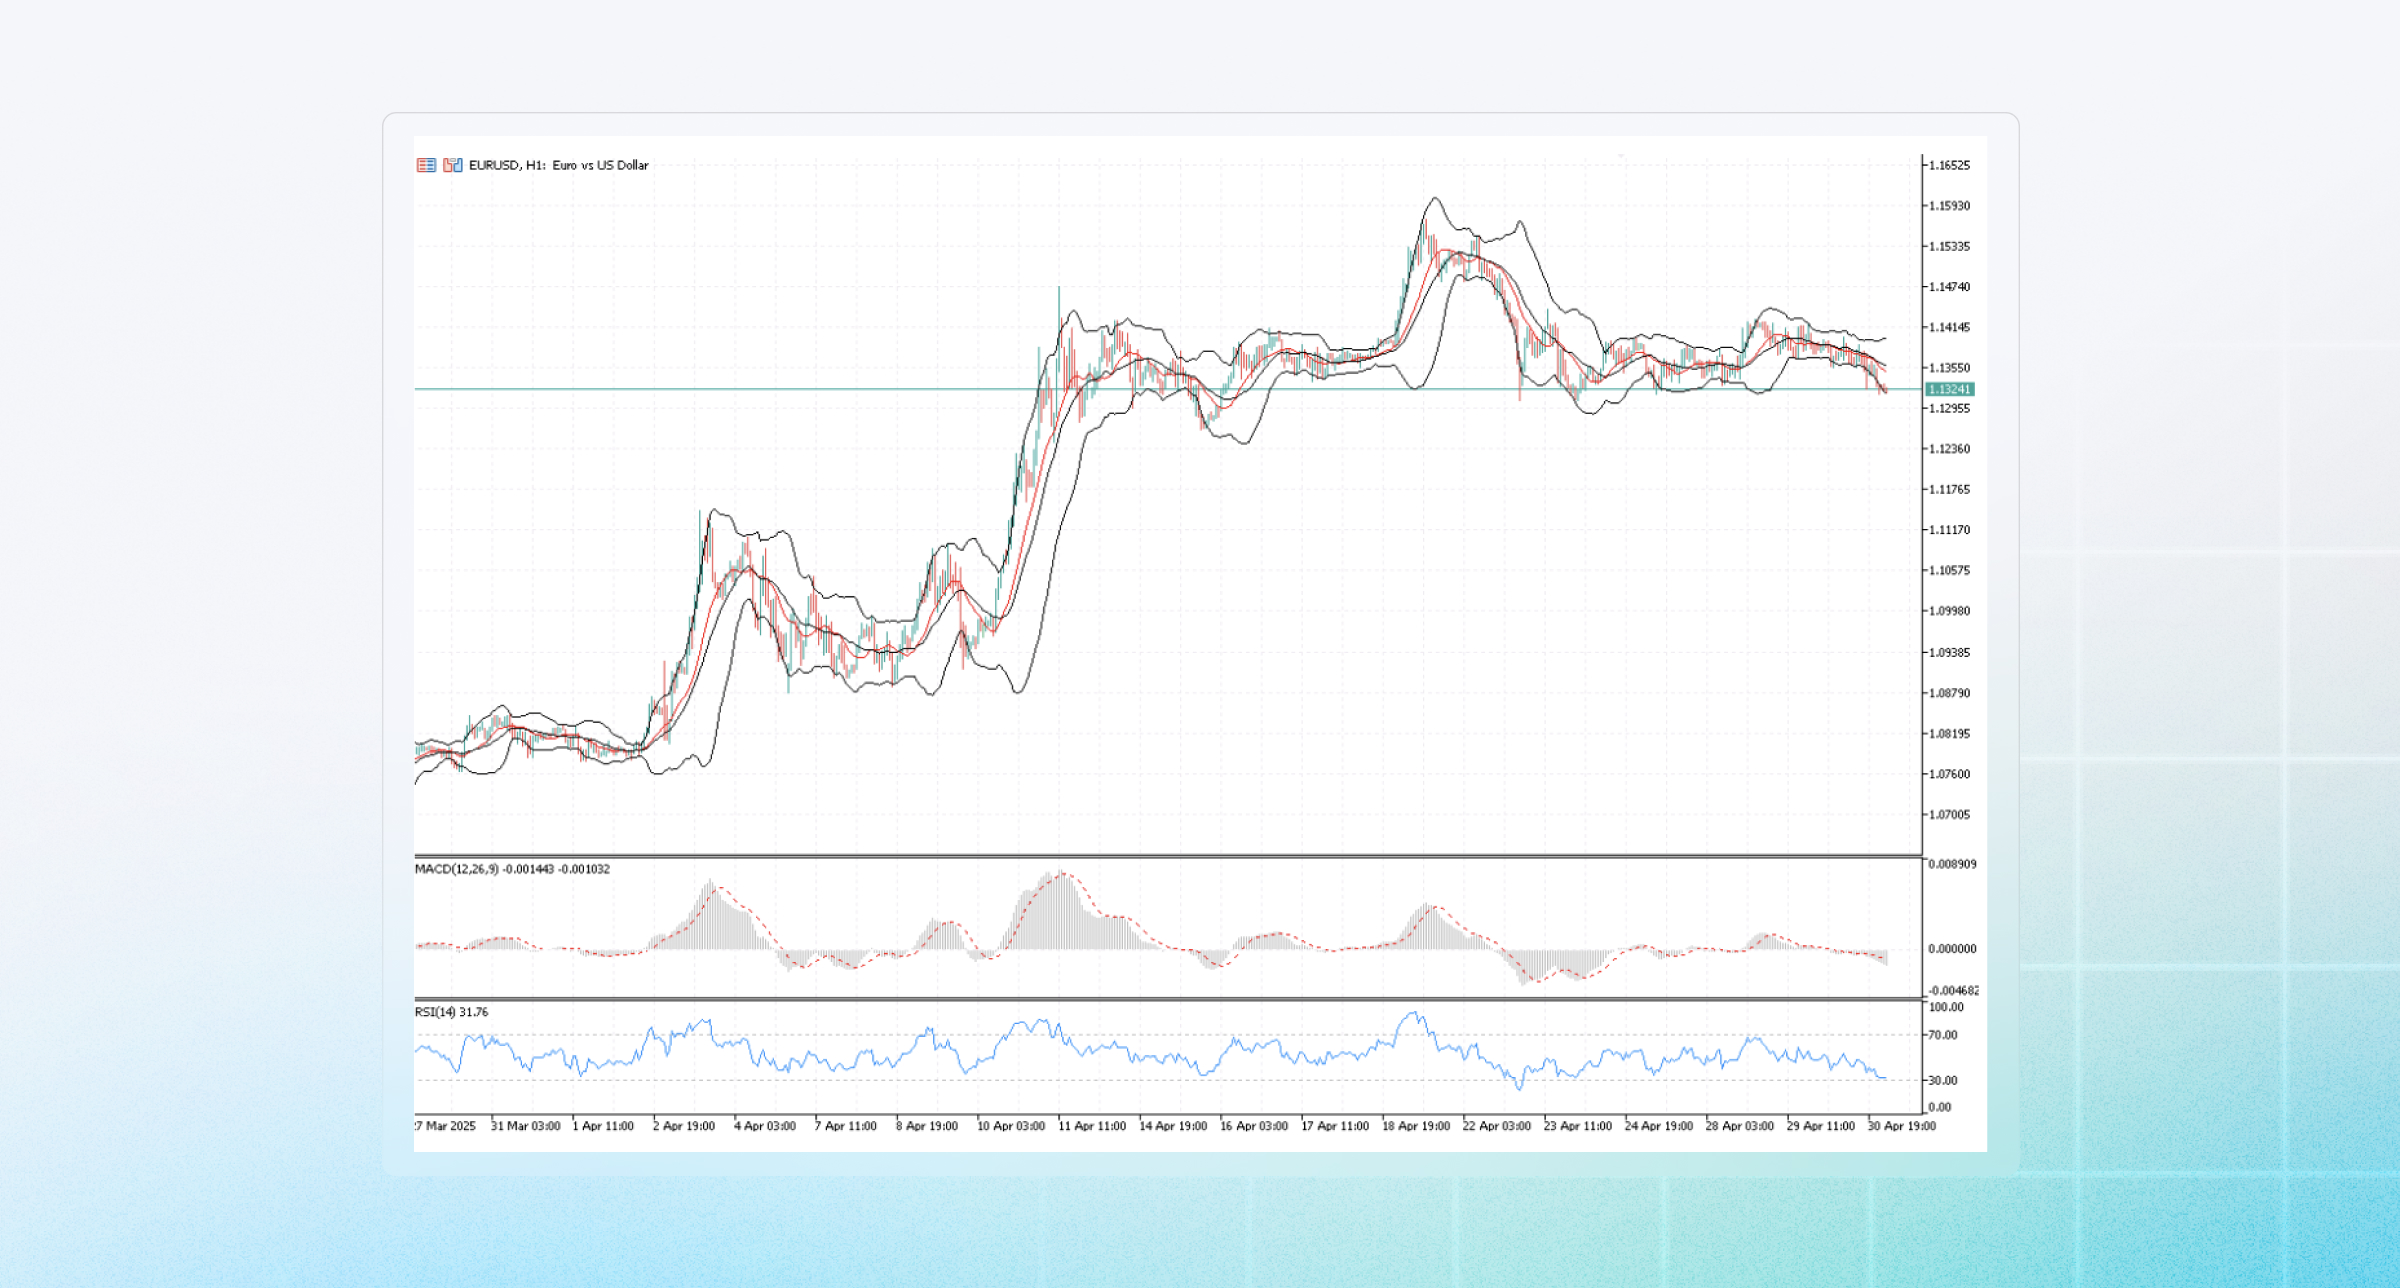
The above indicators are all built-in on all three CPT Markets trading platforms and you can simply add them to your chart easily without any installation. However, using indicators proficiently in trading requires a high level of discipline and many traders combine multiple indicators into a trading plan that suits them.
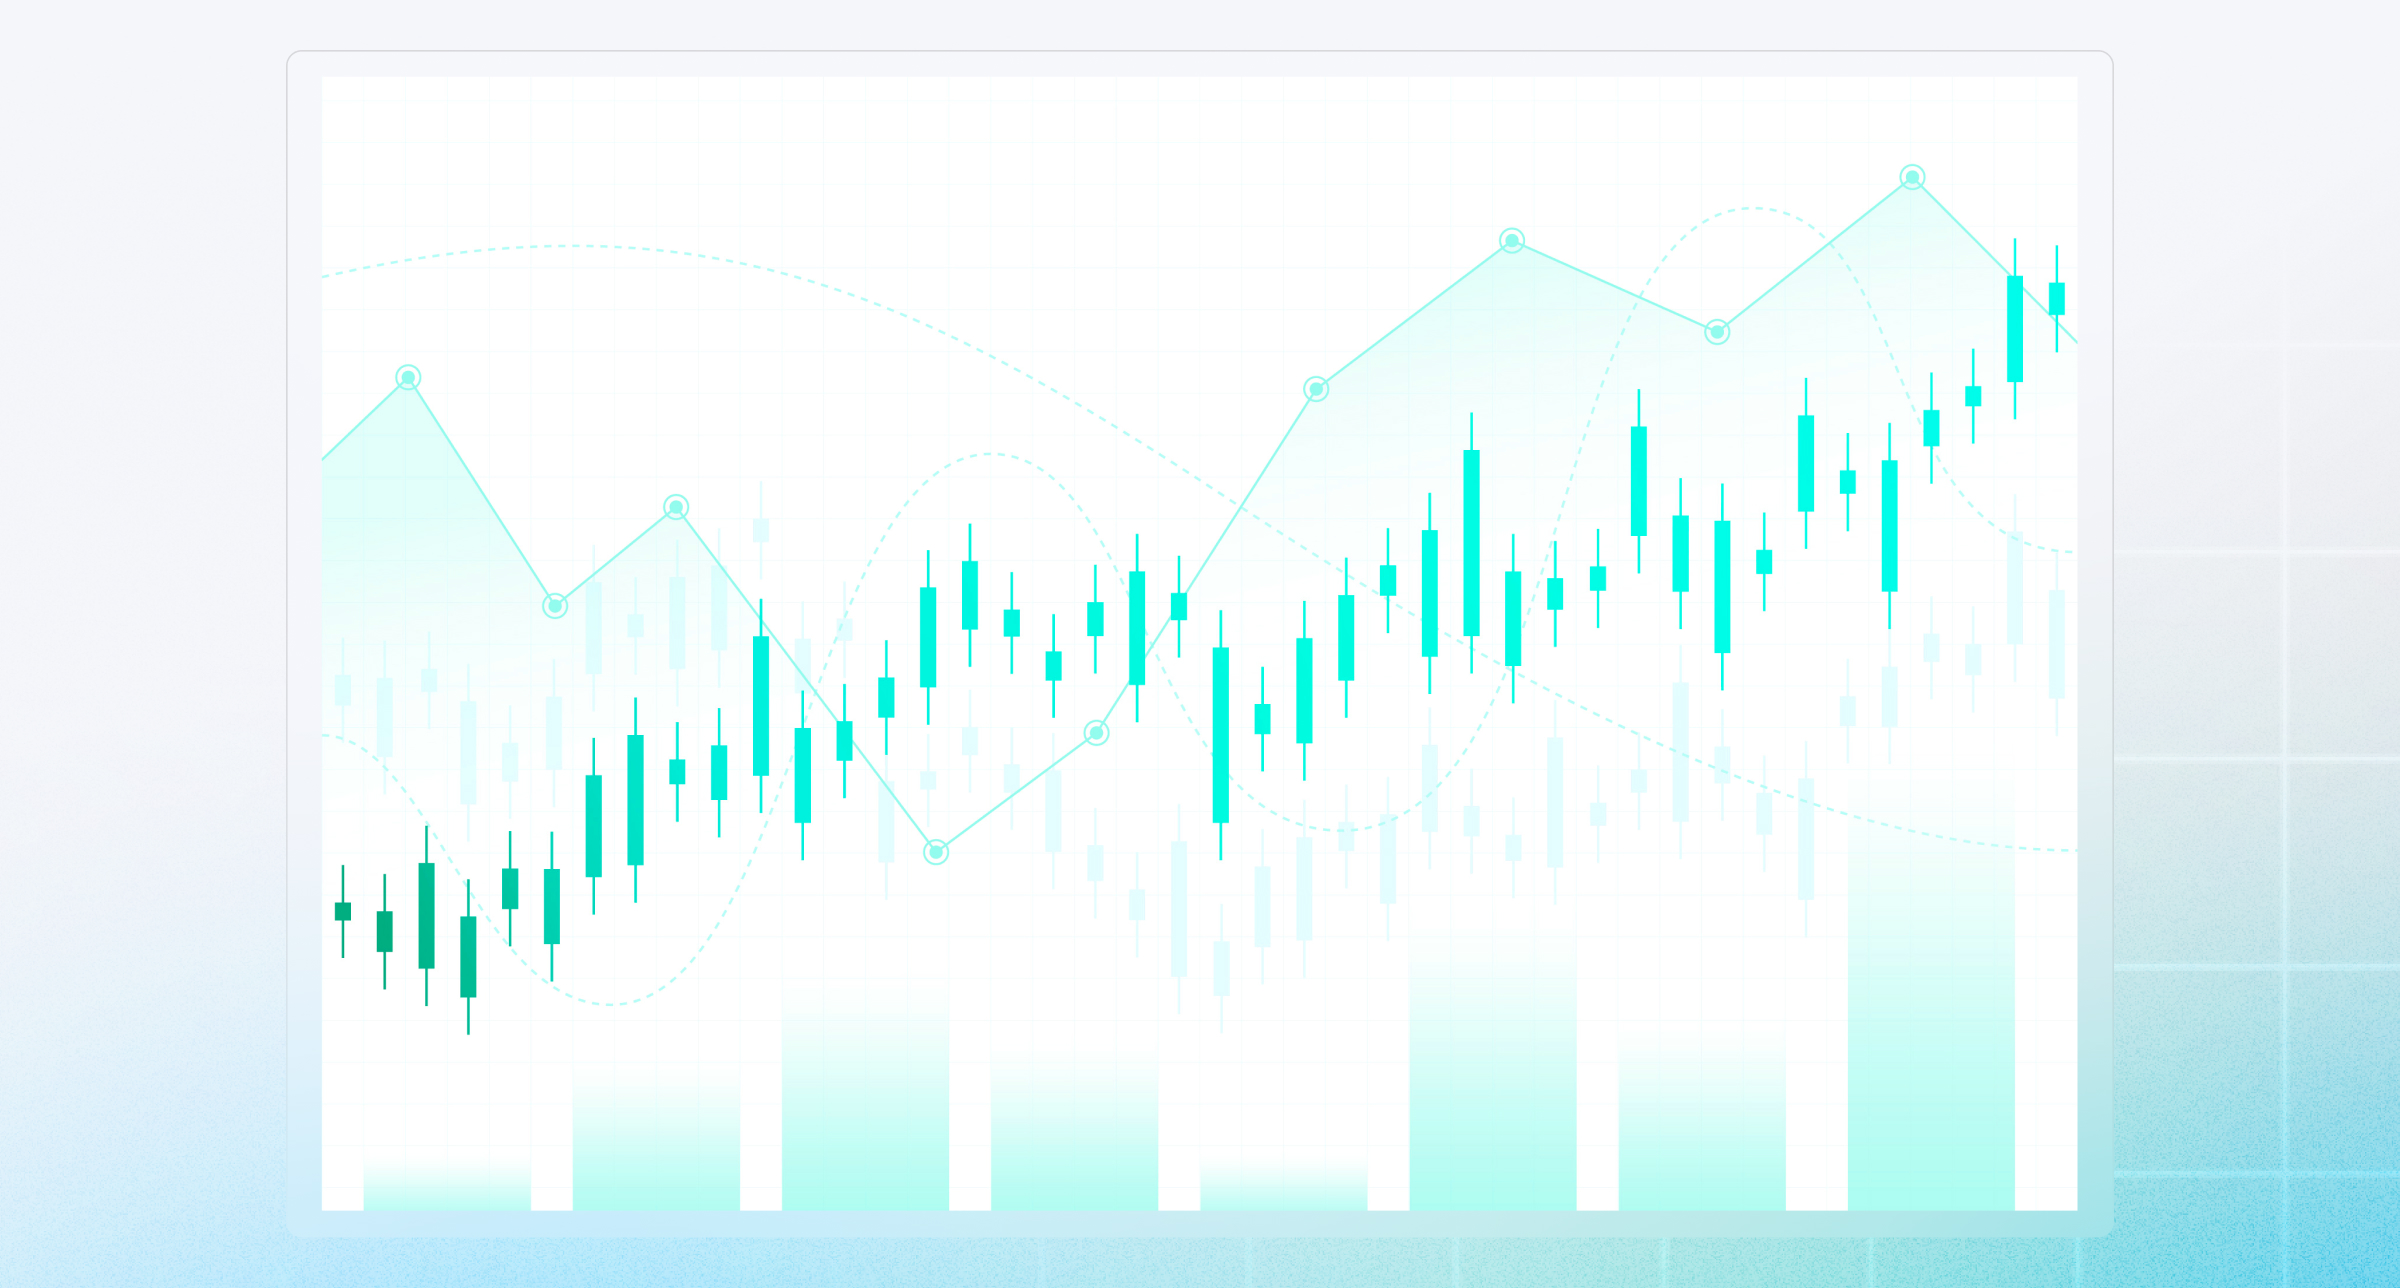
Identify Market Trends
If you don't want to use an indicator but still want to understand what the price chart is showing, you can use the available drawing tools to identify the trend yourself with your hands and eyes. Correctly identifying the market trend is very important. As successful traders once said, "trend is your friend", because it affects the plan and ultimately the result of profit or loss. On the forex chart, or any market, you will only encounter three types of trends: Up, down and sideways.
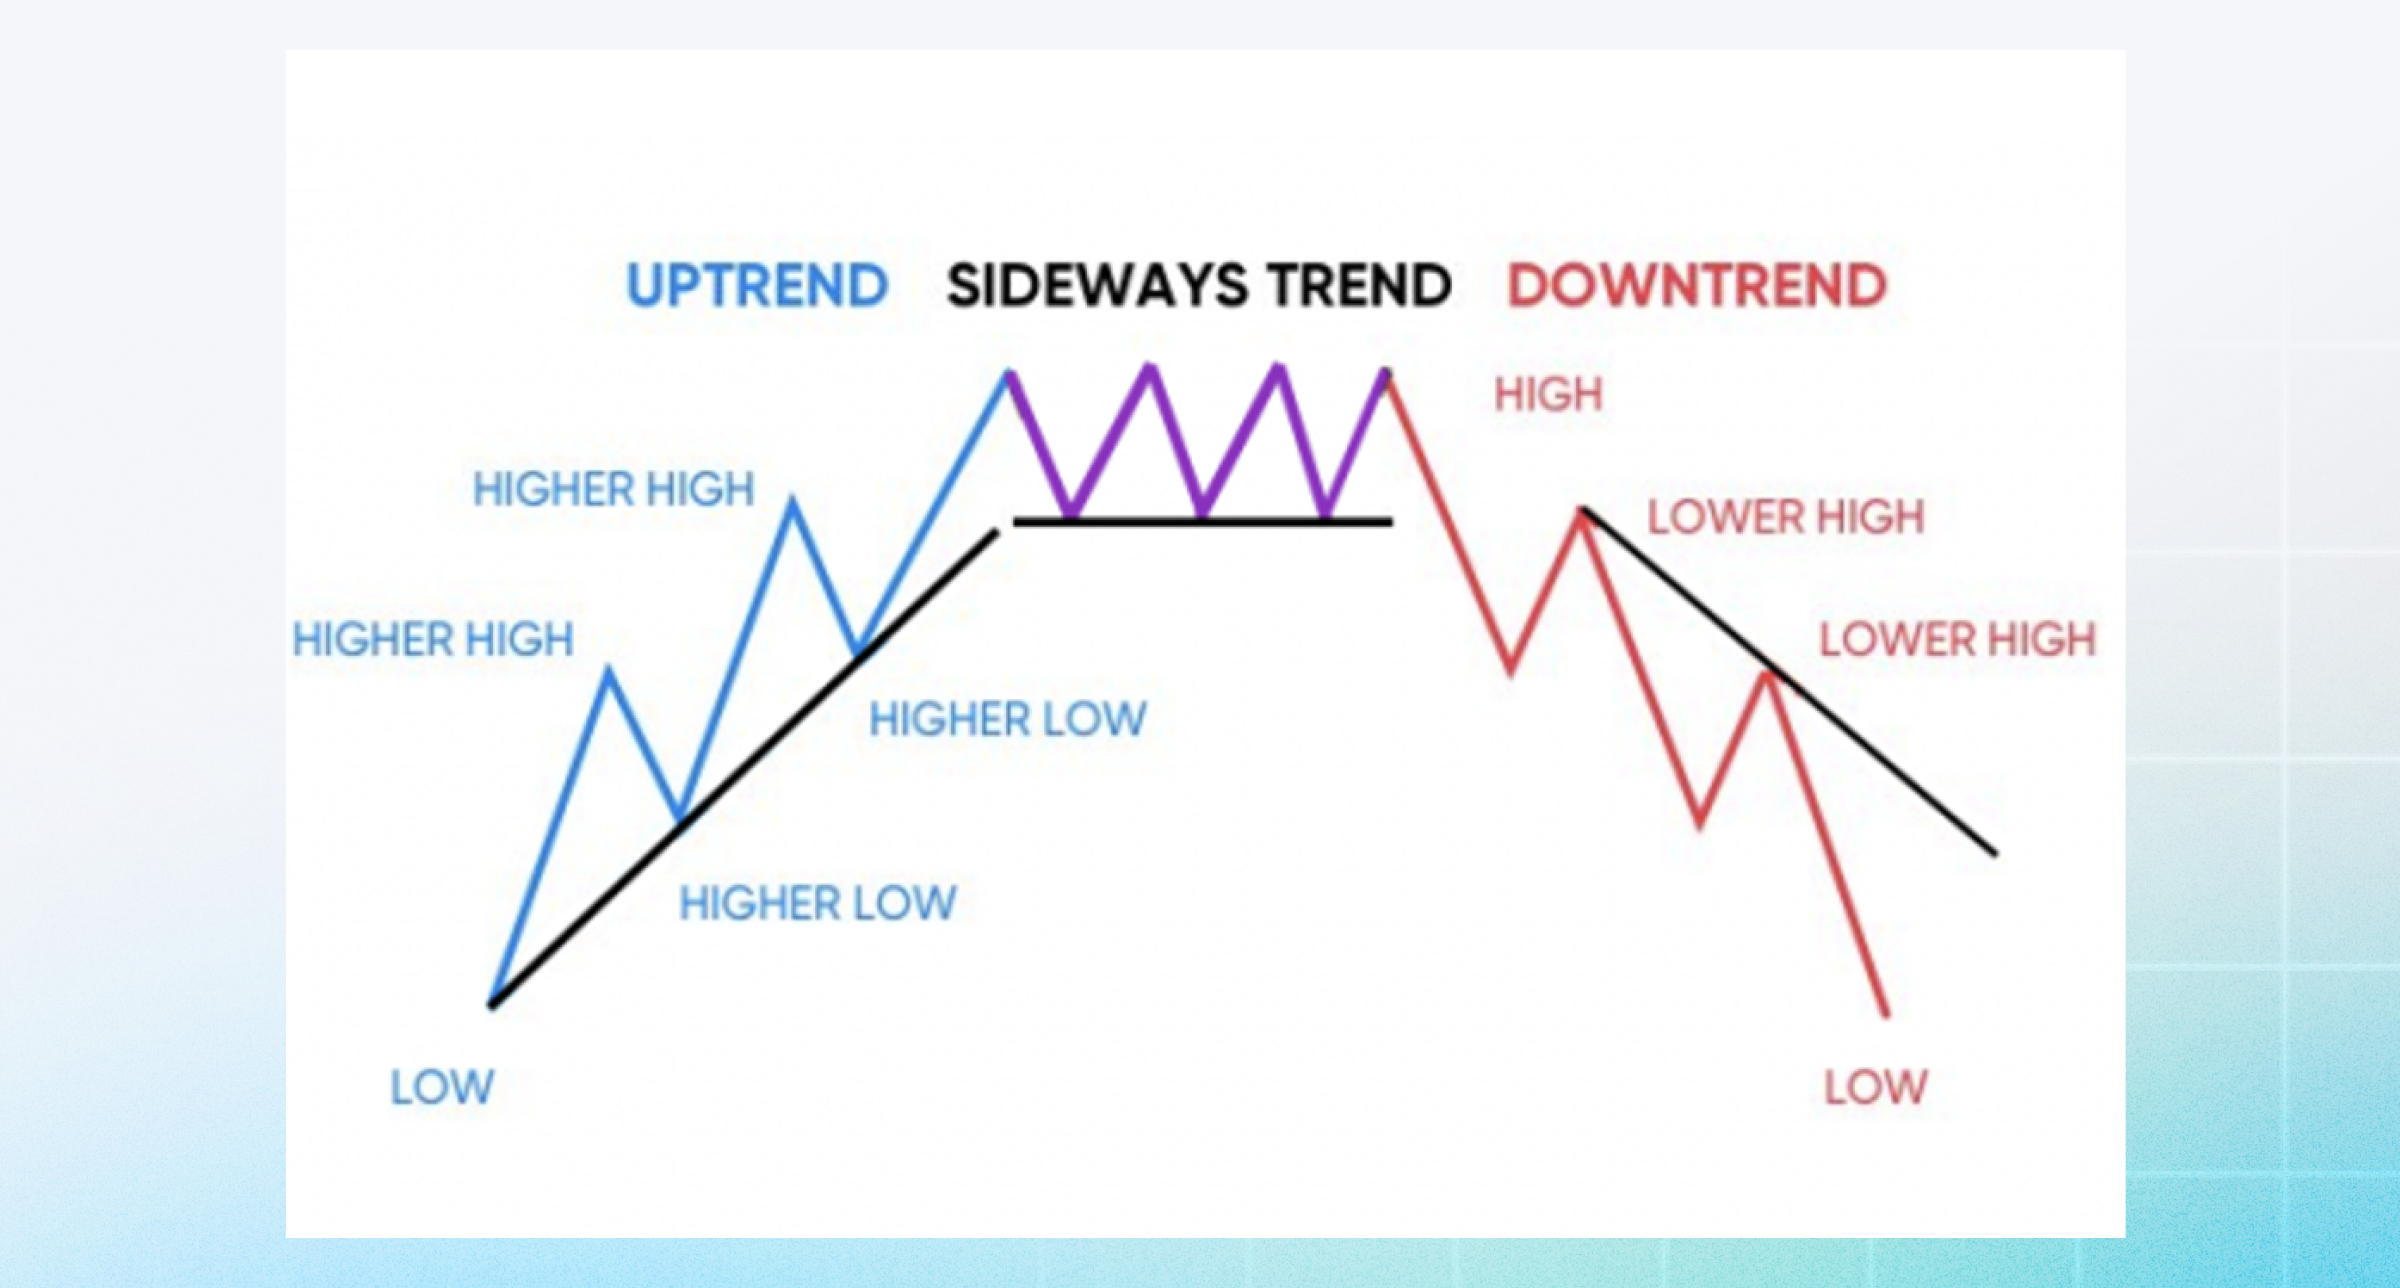
- An uptrend is when prices consistently rise, typically with higher lows and higher highs.
- A downtrend is when prices consistently fall, typically with lower lows and lower highs.
- A sideways trend is when prices fluctuate within a narrow range with no clear trend.
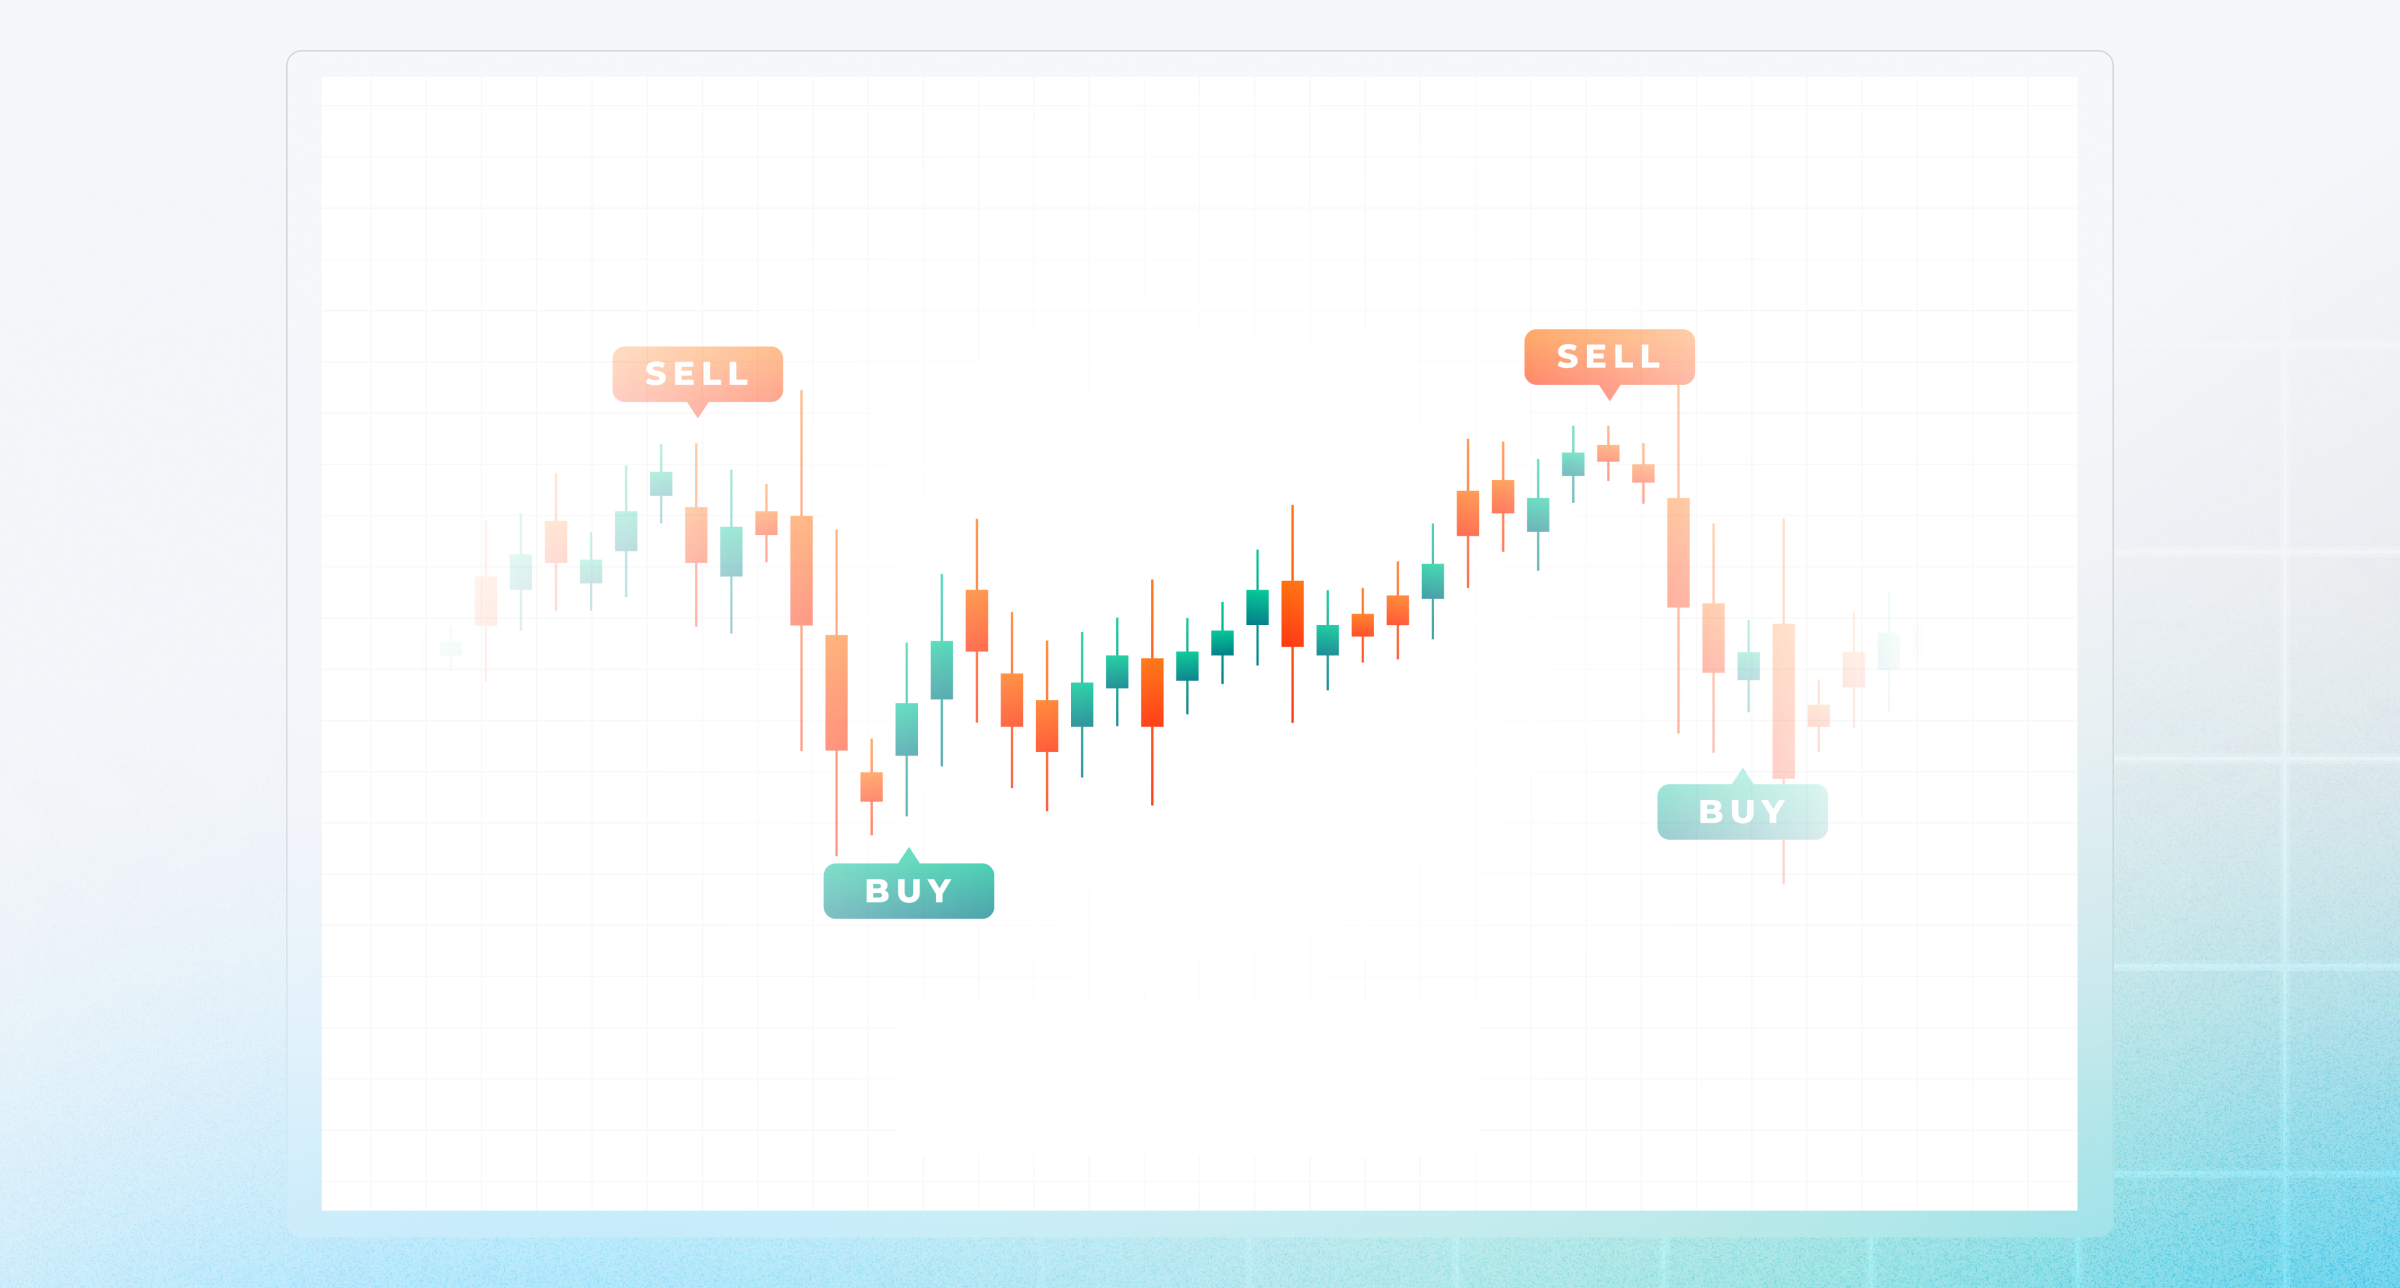
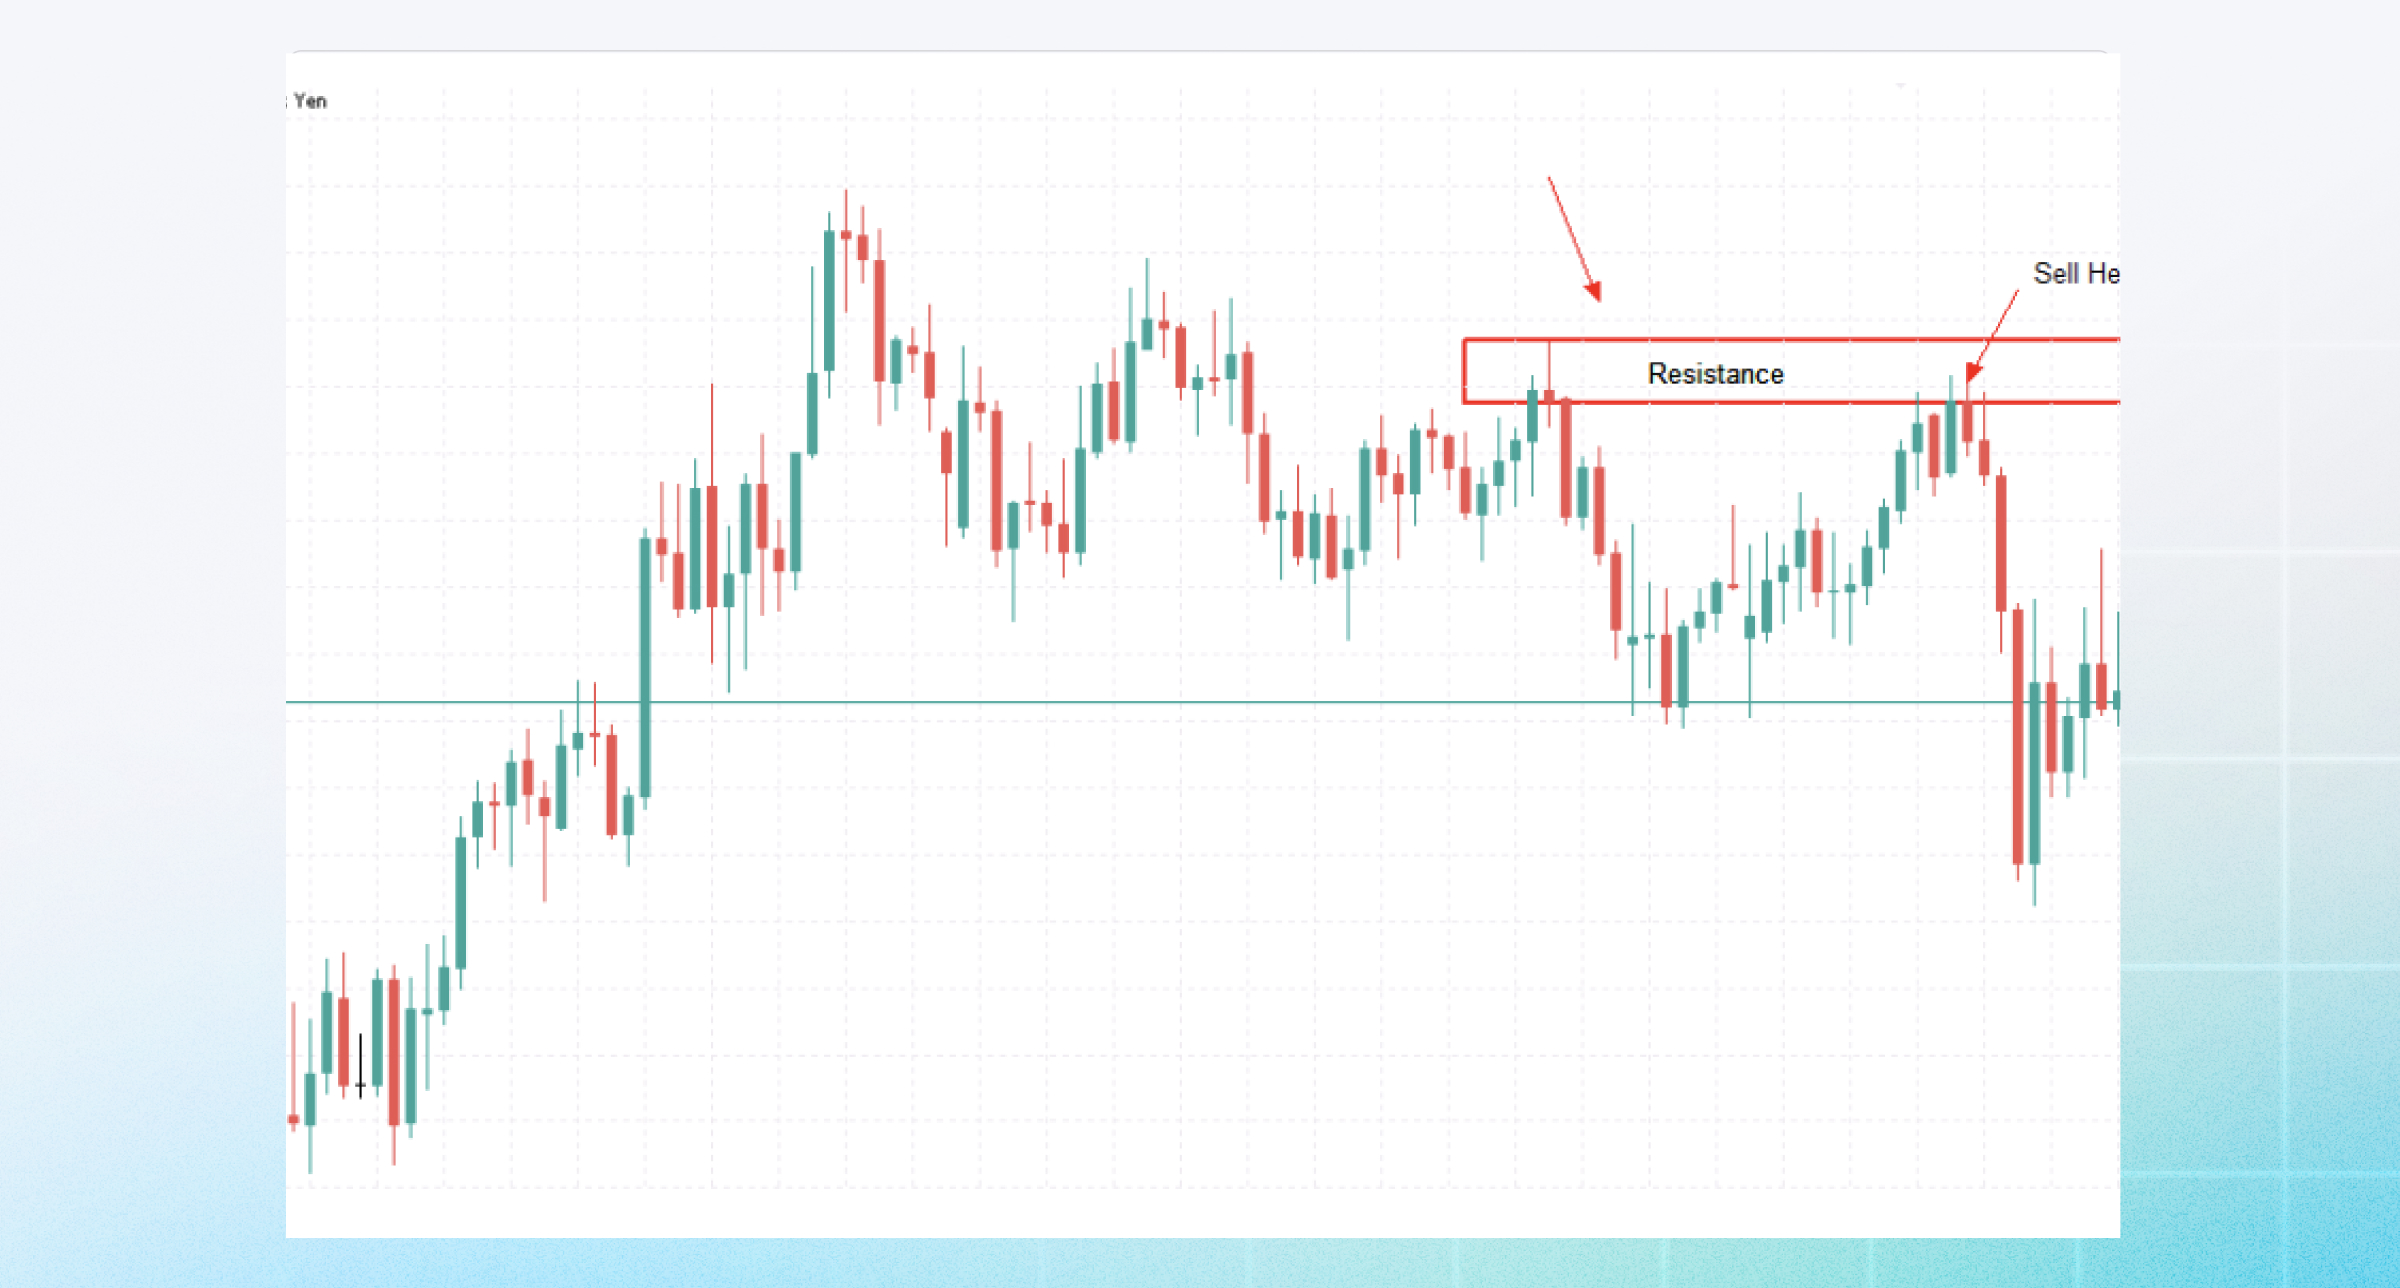
Support and Resistance Levels
Once you have identified the trend the next thing to do is to mark the support and resistance levels on the chart:
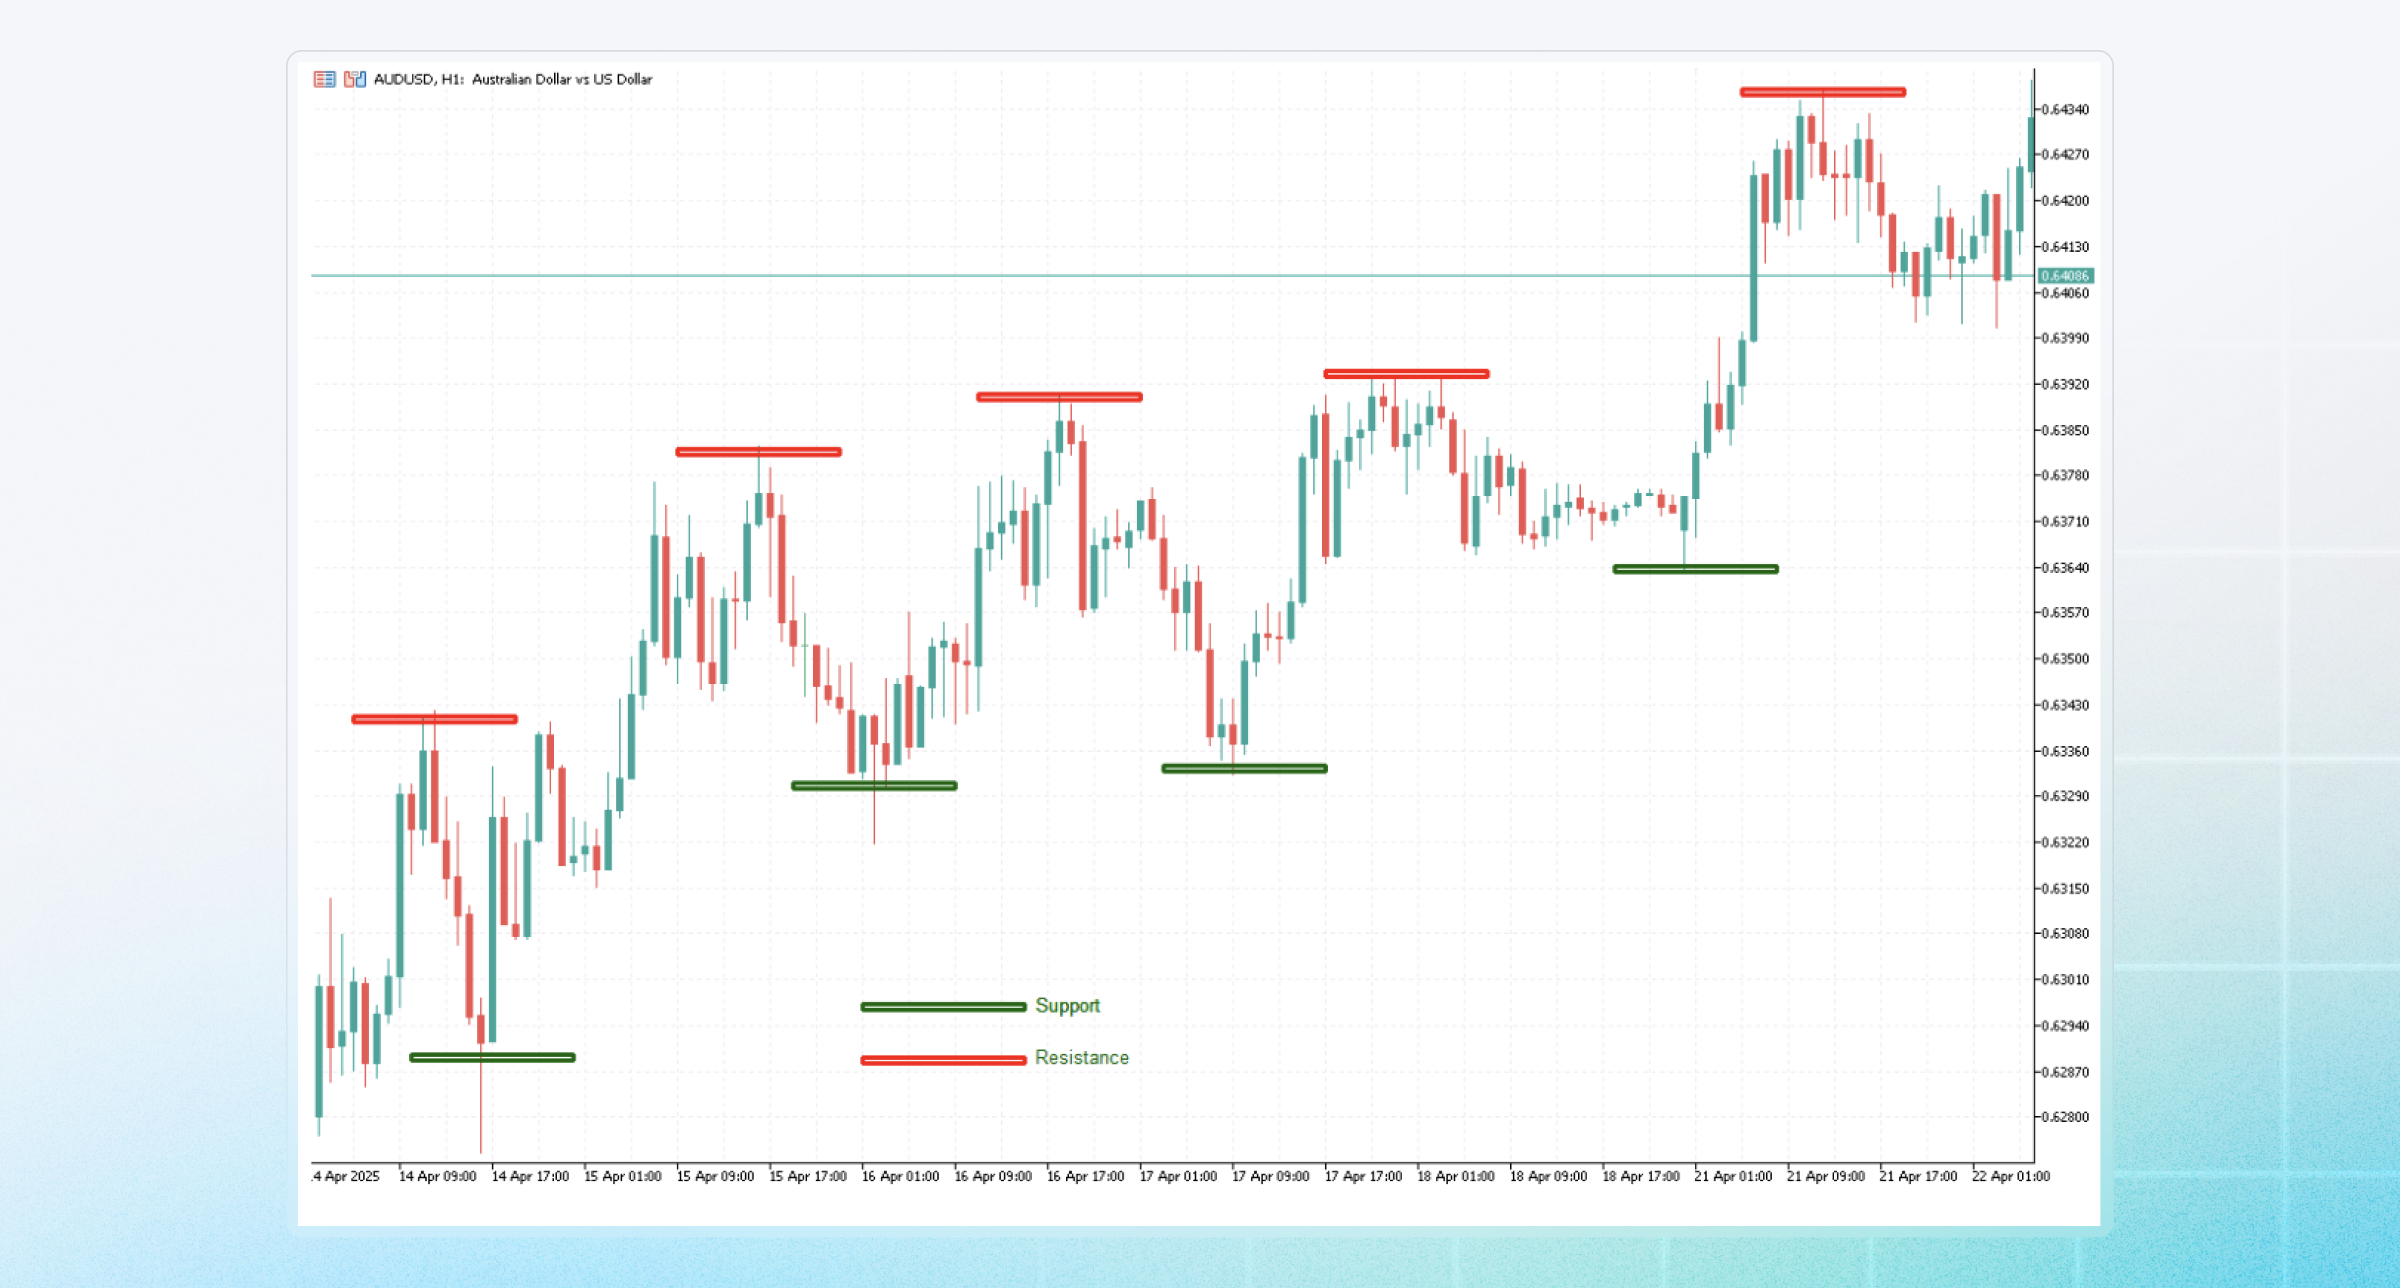
- Support is a price level below which an asset tends not to fall.
- Resistance is a price level that an asset tends not to overcome.
Once you have determined the support and resistance levels, you can use them to make appropriate buy and sell orders.
A small note for you is to always pay attention to the time frames you choose to analyze. Depending on your trading method, but we divide it into three types for easy recognition:
- Short-term timeframes are calculated by minutes (5 minutes, 15 minutes, 30 minutes).
- Medium-term timeframes are calculated by days, hours (1 day, 4 hours, 1 hour).
- Long-term timeframes are calculated by weeks, months, years (1 year, 1 month, 1 week).
Overall, reading forex charts is an essential skill to analyze and understand the price movements of the products you are trading in the market. By mastering how to read different types of charts and identifying important factors such as trends, support and resistance levels, you can make smart and effective trading decisions.
Hopefully CPT Markets' sharing can help you know how to view forex charts and analyze price charts to have a suitable trading strategy. To fully and conveniently experience the great features that CPT Markets offers, download our trading platform now.
With our powerful trading platform, you will not only analyze price charts more easily, but also enjoy extremely low spreads and many special promotions just for you. Sign up and experience the most innovative trading platform with CPT Markets!
Recent Articles
What is swing trading? How to select stocks for swing trading?
June 02, 2025

What is Litecoin & How to Trade LTC in 2025 | CPT Markets
June 01, 2025

What is the highest currency in the world? | CPT Markets
May 20, 2025

Why Beginners Fail in Forex: 5 Common Mistakes to Avoid in 2025
May 10, 2025
Frequently Asked Questions
- Absolutely! Charts are the foundation of trading. Whether you're trading currency pairs, gold, or indices, reading price movements helps you time your entries and exits better. CPT Markets’ platform makes it easy for beginners with clean chart layouts and built-in tools.
- Line charts are simple and show overall trends. Bar charts show more detail like open, close, high, and low. Candlestick charts do the same, but in a more visual way, they’re the most popular among traders. CPT Markets recommends starting with candlestick charts because they make it easier to recognize patterns.
- Technical analysis doesn’t guarantee wins, but it increases your chances of making informed decisions. Like any skill, the more you practice, the better your results. Our Demo Account lets you practice reading charts in real conditions without risking real money.
- Because they combine price data and market psychology into one visual tool. You can spot trends, reversals, and signals faster. On CPT Markets, our charts automatically color bullish and bearish candles, making it easy even for new traders to understand.
- Yes! CPT Markets offers customer support, educational articles, live webinars, and even one-on-one training for new traders. You're never alone on your trading journey.
- We offer user-friendly platforms with professional charting tools, real-time data, lightning-fast execution, and educational resources - all in one place. Plus, our new users enjoy low spreads, a 30% Welcome Bonus, and zero hidden fees. We make it easier for you to learn, trade, and grow.


