What Is Drawdown in Trading? How to Understand It Correctly and Control Risk Effectively
June 23
Drawdown is one of the most important indicators to evaluate the performance and risk level in financial trading, especially Forex. However, many traders, even experienced ones, still do not really understand the nature of drawdown, as well as how to control it effectively..
In this article, CPT will analyze in depth “what is drawdown in trading”, why it is important, and how to protect your trading account from dangerous declines. This is basic but vital knowledge for any trader who wants to survive and develop in the market.
What is Drawdown in Trading?
Drawdown in trading is the largest decrease in equity from the highest peak to the lowest trough of an account in a given period. It is expressed either as an absolute amount or as a percentage of the account peak.
In other words, drawdown reflects the deepest temporary loss an account has ever experienced. It does not count small losses between trades but only focuses on the sharpest drop from peak to trough before recovering.
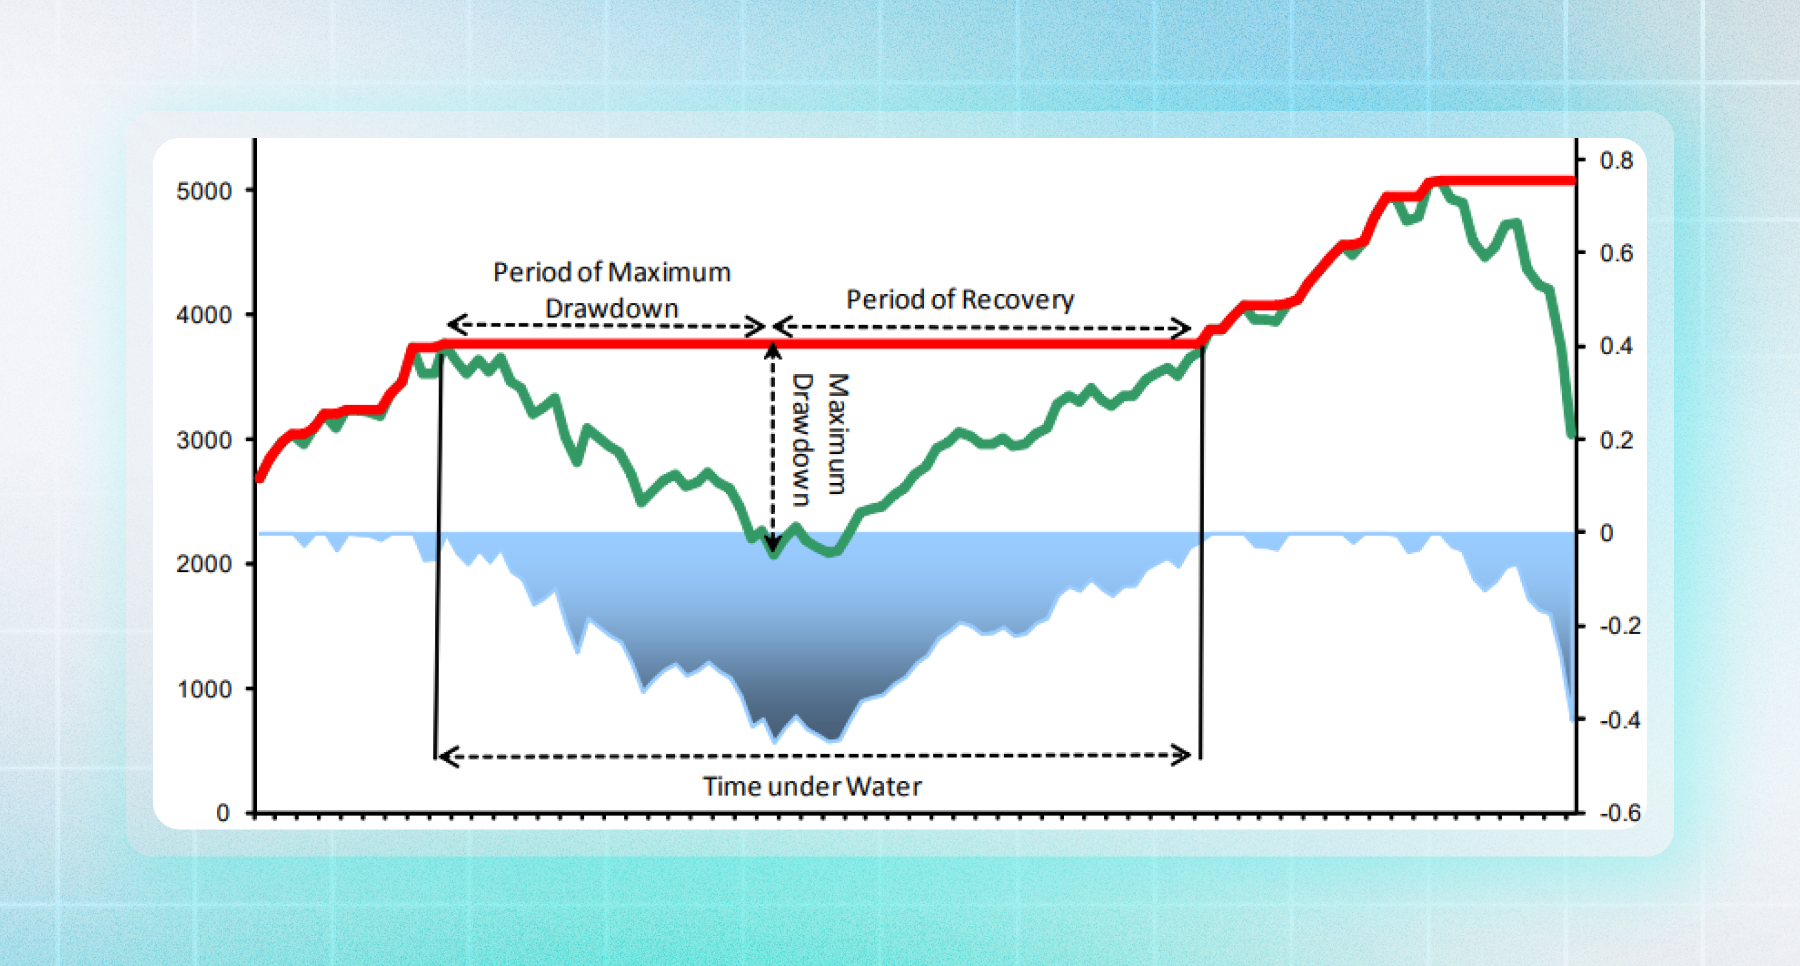
(Drawdown reflects the deepest temporary loss the account has ever experienced)
For example:
- Initial capital: $10,000
- Account growth: $15,000
- After losing streak, remaining balance: $9,000
=> Drawdown = (15.000 - 9.000) / 15.000 = 40%
Types of Drawdown in Trading
Understanding the different types of drawdowns is essential to properly assess the performance and risk of a trading strategy.
(3 Main Types of Drawdown)
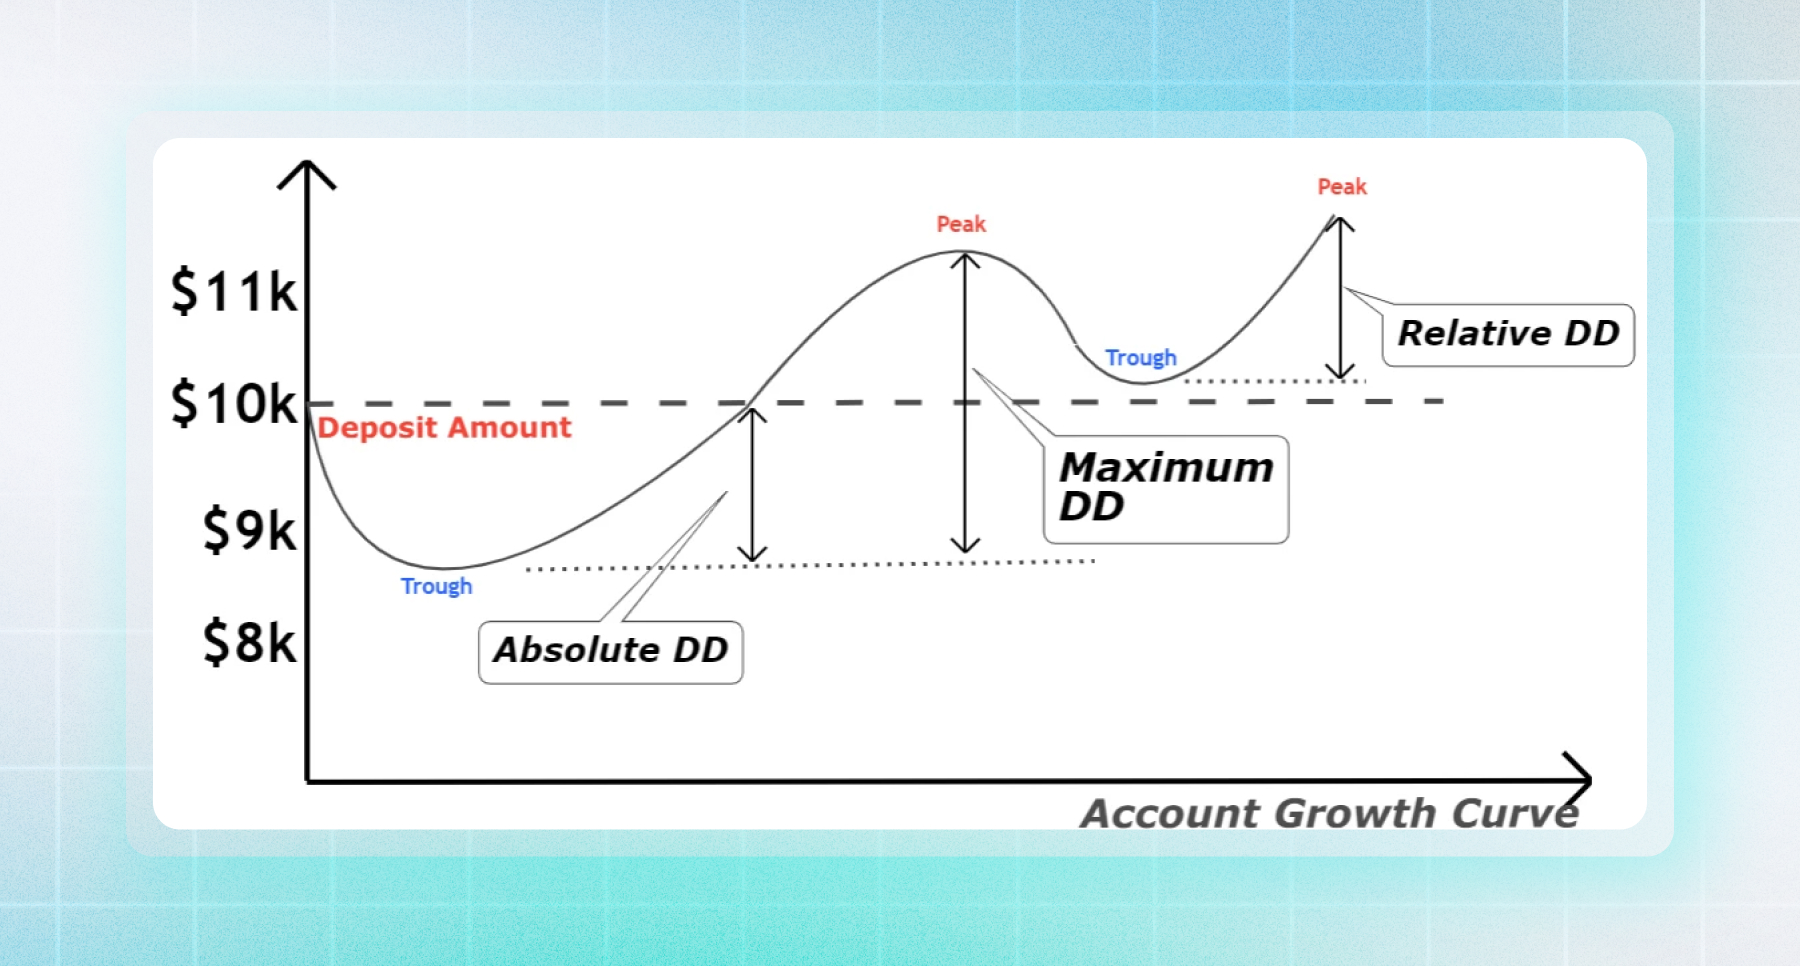
1. Absolute Drawdown:
Absolute Drawdown is the decline from the initial capital to the lowest point of the account. This is the simplest measure of how much money you have lost compared to your original capital.
Meaning: Absolute Drawdown of 0 means that you have not lost any money since the beginning.
2. Maximum Drawdown (MDD)
The largest decline from the highest equity peak to the lowest equity trough in the entire trading cycle. The MDD represents the worst-case scenario your strategy has ever encountered.
Formula: Maximum Drawdown = Highest Equity Peak - Lowest Equity Trough
Meaning: The larger the MDD, the higher the potential risk, and the more difficult the recovery.
3. Relative Drawdown
Relative Drawdown is the percentage of Maximum Drawdown relative to peak equity. This is the most common metric for comparing risk levels between strategies or accounts of different sizes.
Formula: Relative Drawdown = Maximum Drawdown / Peak Equity
For example, if an account peaks at $50,000 and then drops to $35,000, the Relative Drawdown is 30%.
Real-time drawdown types
In addition, we also have advanced types of drawdown. Tracking drawdown over time not only helps you detect risks earlier but also makes decisions faster and more accurately in each trading stage.
Below are three common types of drawdown that professional traders often use to manage risks in real time:
- Daily Drawdown: Capital drawdown within a trading day, often used for scalpers. If during the day, the drawdown exceeds the allowed level (for example 3–5%), you should stop trading immediately to avoid deeper losses due to emotions or unusual market fluctuations.
- Balance Drawdown: Based on account balance, not counting floating loss/profit. This is a stable and less volatile drawdown, often used to evaluate overall performance after a trading cycle.
- Equity Drawdown: Including open orders - reflects the current risk status most accurately. For example, if your account has a balance of 10,000 USD, but is losing 2,000 USD in open orders, your Equity drawdown is 20%. Professional traders often monitor equity drawdown every hour, even every minute, to make timely decisions to close orders, reduce volume or cut losses.
Understanding the types of drawdowns in real time helps you not only look back at the risks that have occurred but also predict and adjust your trading behavior before it's too late.
Why is Drawdown Important in Trading?
- Measure real risk: Unlike the profit rate, the drawdown shows how much loss you have gone through to get to your current profit. A profitable trading system with a large drawdown still has the potential to “wipe out your account”.
- Determine a reasonable stopping point: By monitoring drawdowns, traders can know when to stop to re-evaluate their strategy, avoiding continuing to trade in a negative psychological state.
- Helps manage expectations: Drawdowns are also a tool for guiding realistic expectations. Understanding the risks involved will help you avoid unreasonable expectations of short-term returns.
- Impact on recovery ability: The larger the drawdown, the higher the profit margin needed to break even. This is the factor that prevents many traders from recovering from losing streaks.
Please refer to the following table to see the profit needed to break even when there is too much drawdown:
| Drawdown Level | Profit needed to break even |
|---|---|
| 10% | 11% |
| 20% | 25% |
| 50% | 100% |
| 80% | 400% |
What is a reasonable Drawdown level?
There is no fixed threshold for every trader. However, as a general rule:
- Below 10%: Very safe
- From 10 - 20%: Acceptable for medium-term investors
- Above 30%: Dangerous, need to review strategy
- Above 50%: Serious risk, low recovery potential
Each trader needs to determine the maximum drawdown they can accept based on experience, including profit targets and psychological control.
Effective Drawdown Control Strategies
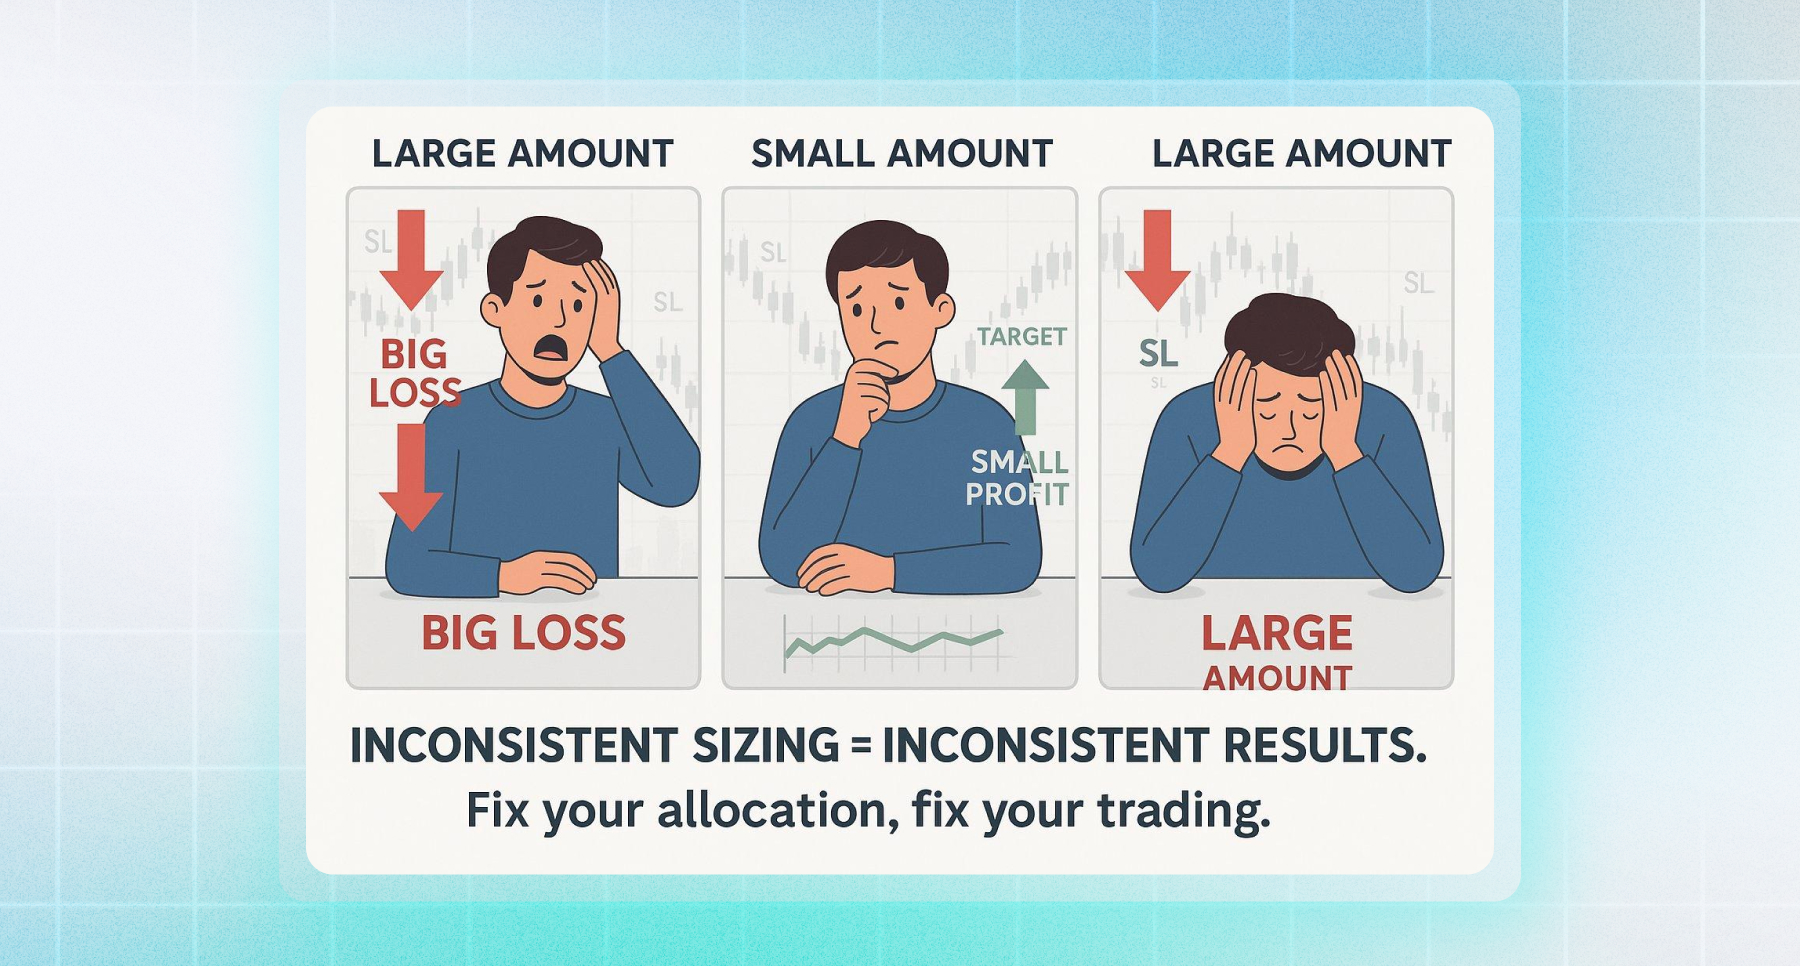
1. Risk limit for each order: Applying the 1 - 2% risk per trade rule is the optimal way to ensure overall drawdown is always under control.
2. Reduce trading volume when losing: If you are on a losing streak, reduce your position size. This helps preserve capital and maintain your sanity.
3. Set Drawdown limit by day/week/month: When you reach this threshold, you should stop trading to re-evaluate your system. This is a key step in building discipline
4. Apply smart capital recovery strategies: After a drawdown, you should not double your risk to “recover losses” quickly. Instead, you need to maintain a small, safe volume and patiently recover slowly.
5. Keep a trading journal to spot mistakes: Tracking every trade helps you identify the cause of your drawdown, from wrong strategy, money management, or unstable trading psychology.
Drawdown - trader risk map
Understanding “what is drawdown in trading” will not only help you read the numbers better, but it will also help you survive and thrive in the market long term.
Don’t just look at the profits. Look at how your account reacts to a drawdown. The difference between a losing trader and a professional trader is the ability to control risk, not maximize profits.
At CPT Markets , we always encourage investors to build a trading mindset based on the principles of drawdown control and smart capital management. Experience “No Limits” trading with our advanced trading platform today!
Recent Articles
What Is Drawdown in Trading? Master Risk Control Like a Pro | CPT Markets Group
June 23, 2025
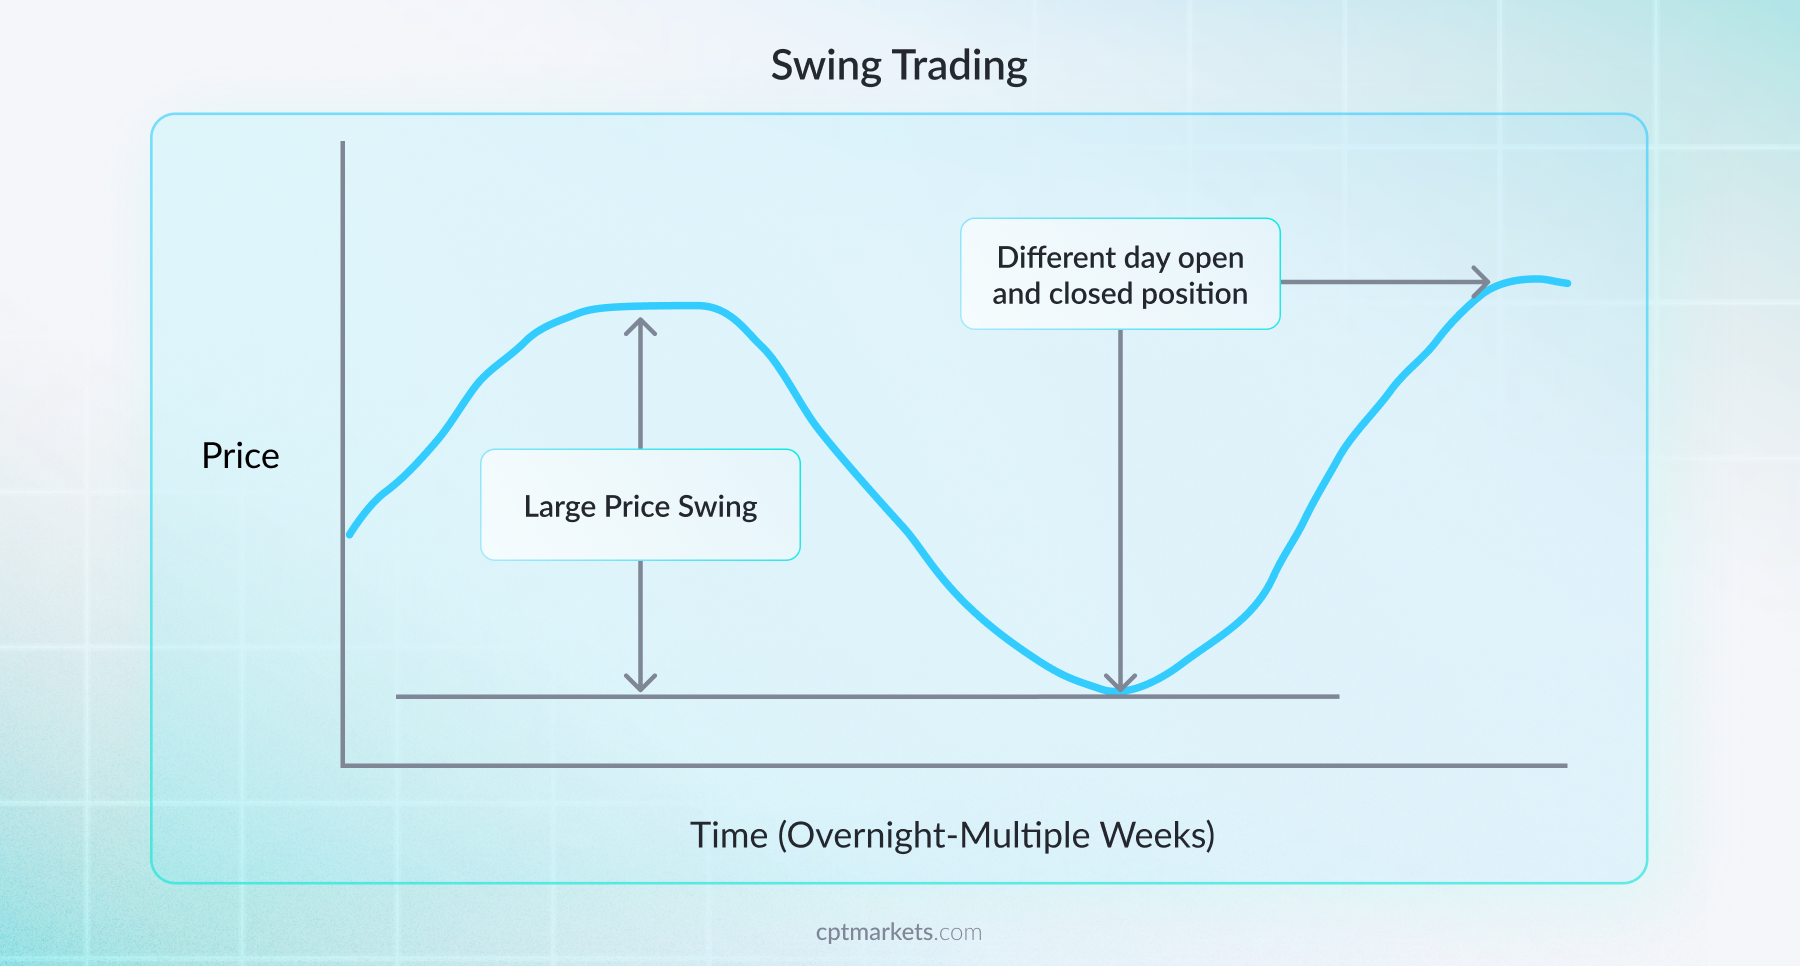
What is swing trading? How to select stocks for swing trading?
June 02, 2025

What is Litecoin & How to Trade LTC in 2025 | CPT Markets Group
June 01, 2025

What is the highest currency in the world? | CPT Markets Group
May 20, 2025

Why Beginners Fail in Forex: 5 Common Mistakes to Avoid in 2025
May 10, 2025
How to Read Forex Charts Like a Pro (Even If You’re New)
May 8, 2025
Frequently Asked Questions
- Drawdown is the largest decline in an account from the highest peak to the lowest trough. It is a key indicator to assess the risk level of a trading strategy and the account’s ability to recover.
- CPT Markets Group provides powerful risk management tools such as limit orders, stop loss, and especially trailing stoploss to help you automatically lock in profits and limit losses in real time.
- We support both MT4 and MT5. Drawdown metrics are clearly displayed on the trading platform, and you can also easily access detailed reports on drawdown history, trade performance, and recovery rates, helping you analyze trading efficiency effectively.
- You should monitor Maximum Drawdown, Equity Drawdown, and Daily Drawdown. With the CPT Markets Group platform, you can set up automatic alerts when your account exceeds safe drawdown thresholds.
- CPT Markets Group supports customizable scripts and Expert Advisors (EAs) that can automatically close all trades or disable new trades once your account reaches a predefined drawdown level.


